Precomputed shape-recognition sensitivity results (demo)
Source:R/shape_sensitivity_demo-doc.R
shape_sensitivity_demo.RdRaw output from a small-footprint invocation of
janusplot_shape_sensitivity(). Shipped so users can explore the
sensitivity API and regenerate every figure in the
shape-recognition-sensitivity vignette without having to re-run
the sweep themselves. Regenerated via
data-raw/shape_sensitivity_demo.R.
Design:
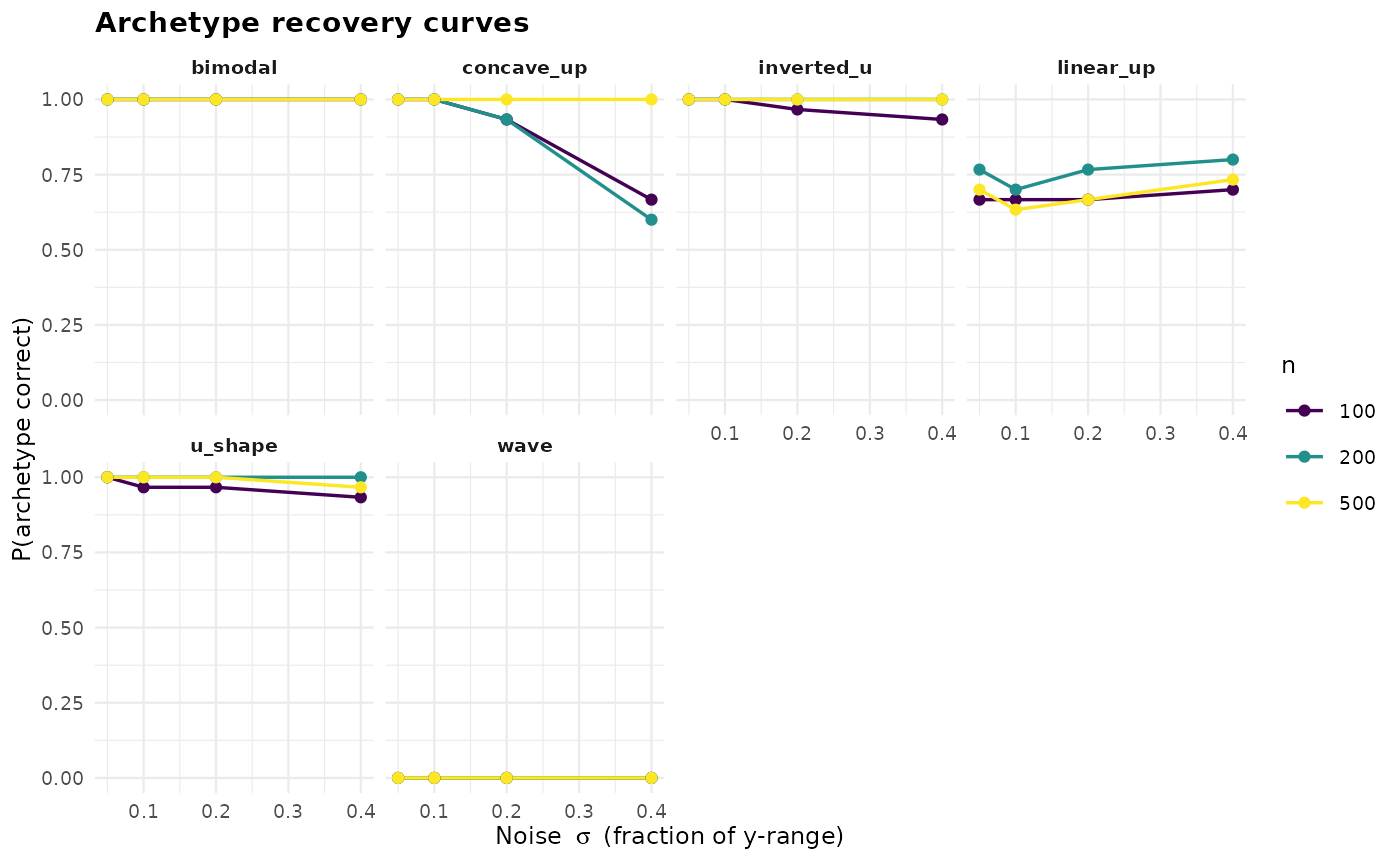
Shapes (6, one per non-degenerate archetype):
linear_up,concave_up,u_shape,inverted_u,wave,bimodal.Sample sizes (3):
c(100, 200, 500).Noise levels (4):
c(0.05, 0.10, 0.20, 0.40)fraction of y-range.Replicates: 30.
Total fits: 2160.
Seed: 2026.
Format
A data frame with 2160 rows and 14 columns — see the
"Value" section of janusplot_shape_sensitivity() for the
column schema.
Examples
data("shape_sensitivity_demo", package = "janusplot")
head(shape_sensitivity_demo)
#>        truth   n sigma seed  predicted correct archetype_truth  archetype_pred
#> 1  linear_up 100  0.05 2027  linear_up    TRUE monotone_linear monotone_linear
#> 2 concave_up 100  0.05 2028 concave_up    TRUE monotone_curved monotone_curved
#> 3    u_shape 100  0.05 2029    u_shape    TRUE        unimodal        unimodal
#> 4 inverted_u 100  0.05 2030 inverted_u    TRUE        unimodal        unimodal
#> 5       wave 100  0.05 2031 broad_peak   FALSE            wave        unimodal
#> 6    bimodal 100  0.05 2032    bimodal    TRUE      multimodal      multimodal
#>   archetype_correct monotonicity_index convexity_index n_turn n_inflect error
#> 1              TRUE         1.00000000       0.0000000      0         0  <NA>
#> 2              TRUE         1.00000000      -0.8465475      0         0  <NA>
#> 3              TRUE         0.11665809       1.0000000      1         0  <NA>
#> 4              TRUE         0.15257336      -1.0000000      1         0  <NA>
#> 5             FALSE        -0.01095819      -0.3279191      1         2  <NA>
#> 6              TRUE        -0.07937189      -0.2582627      3         2  <NA>
janusplot_shape_sensitivity_plot(shape_sensitivity_demo,
                                 "recovery_curves")