Visualise a shape-sensitivity sweep
Source:R/shape-sensitivity.R
janusplot_shape_sensitivity_plot.Rd![[Experimental]](figures/lifecycle-experimental.svg)
Produce one of four diagnostic plots from the raw data frame returned
by janusplot_shape_sensitivity():
"confusion_fine"24 x (|shapes|) confusion matrix at the fine category level — rows = ground truth, columns = predicted, cells coloured by
P(pred | truth)."confusion_archetype"7 x 7 confusion matrix at the archetype level.
"accuracy_grid"per-shape heatmap of archetype-level accuracy across the
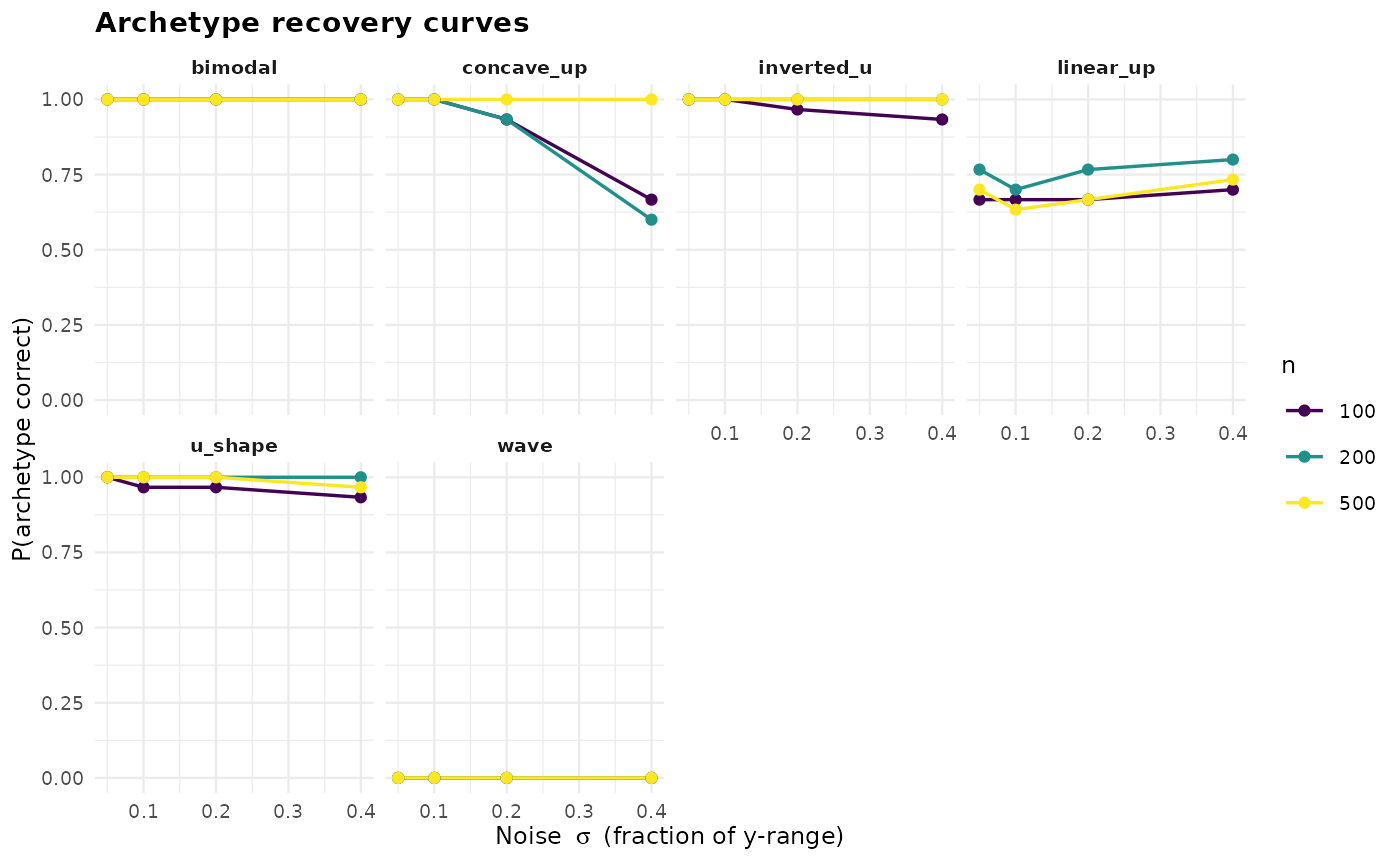
(n, sigma)design."recovery_curves"accuracy as a function of sigma, one line per sample size, faceted by shape.
Usage
janusplot_shape_sensitivity_plot(
  results,
  type = c("confusion_fine", "confusion_archetype", "accuracy_grid", "recovery_curves")
)
Arguments
- results
Data frame from
janusplot_shape_sensitivity()or the precomputed shape_sensitivity_demo.- type
One of
"confusion_fine","confusion_archetype","accuracy_grid", or"recovery_curves".
Value
A ggplot2::ggplot object.
See also
Other shape-sensitivity:
janusplot_shape_sensitivity(),
janusplot_shape_sensitivity_shapes(),
janusplot_shape_sensitivity_summary()
Examples
data("shape_sensitivity_demo", package = "janusplot")
janusplot_shape_sensitivity_plot(shape_sensitivity_demo,
                                 "recovery_curves")