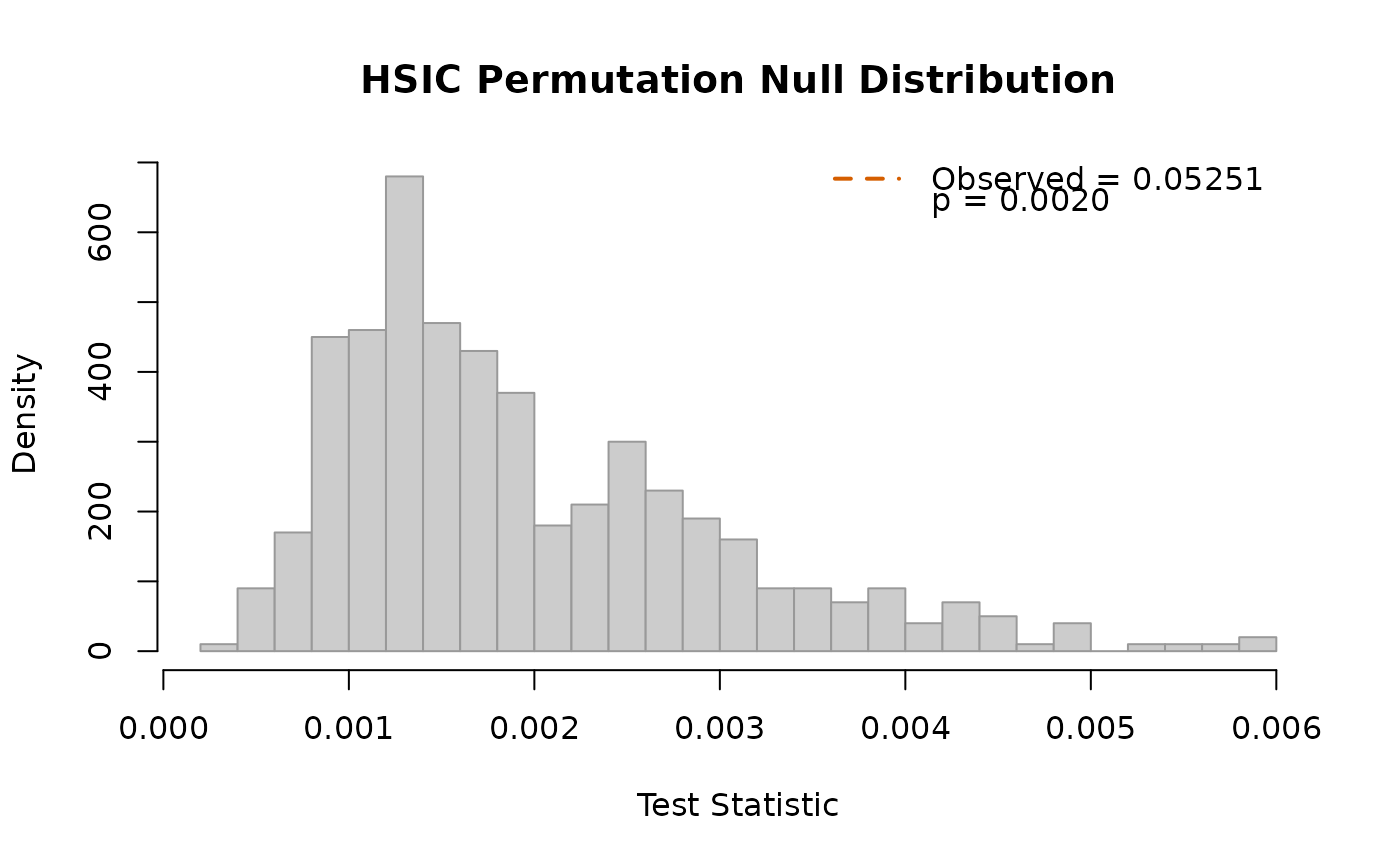
Plots the permutation null distribution with the observed statistic.
Usage
# S3 method for class 'kernel_test_result'
plot(x, ...)Plots the permutation null distribution with the observed statistic.
# S3 method for class 'kernel_test_result'
plot(x, ...)