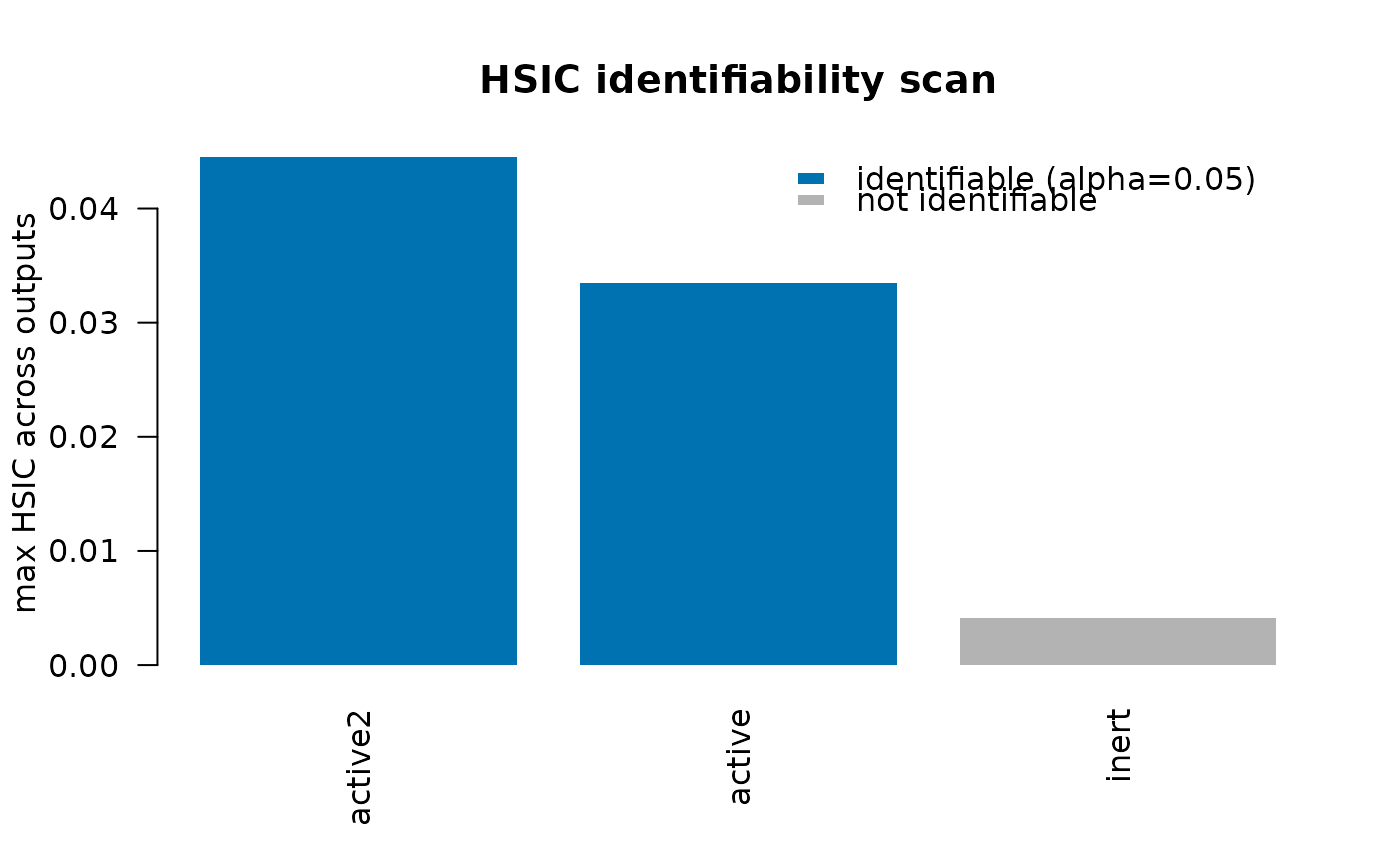
Bar plot of per-parameter maximum HSIC across outputs, ordered by magnitude. Bars for identifiable parameters are coloured; non- identifiable parameters are shown in grey.
Usage
# S3 method for class 'hsic_identifiability'
plot(x, col_yes = "#0072B2", col_no = "grey70", ...)
Arguments
- x
An
hsic_identifiabilityobject.- col_yes, col_no
Bar colours for identifiable / non-identifiable parameters.
- ...
Additional arguments passed to
graphics::barplot().